Open Access
Fig. 2
Download original image
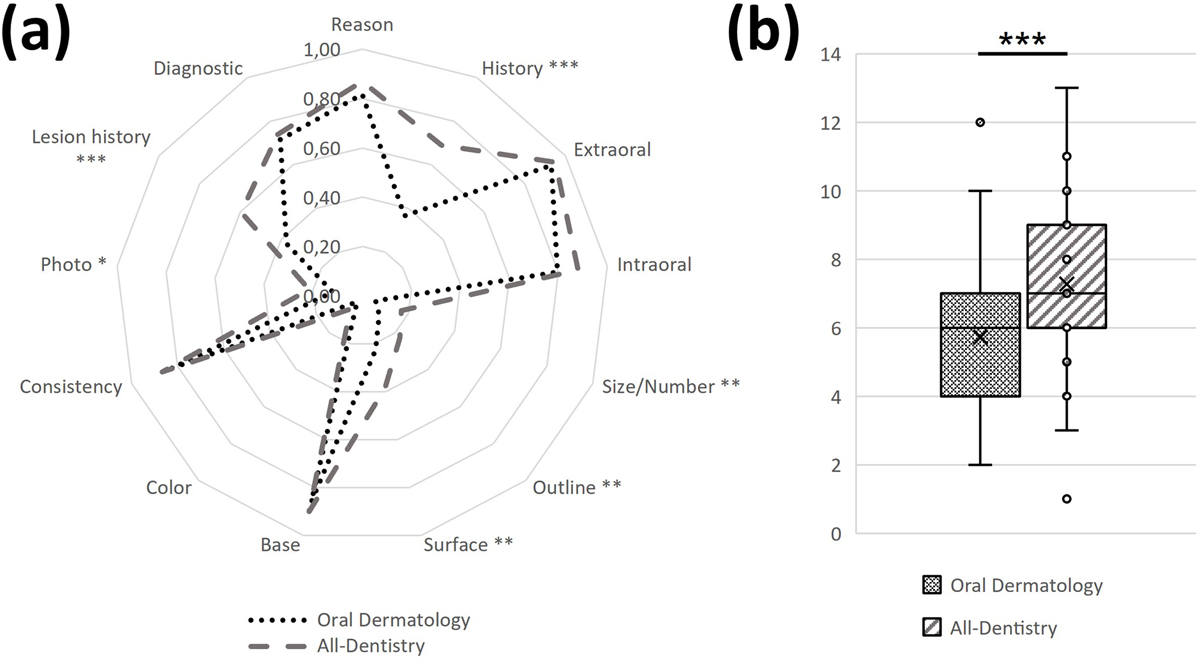
Scoring grid results for both groups. (a) Radar graph of all communication scores for each criterion. 0 means the presence of the point and 1 the absence. (b) Box-plots of average total score, comparing the All-Dentistry group and the Oral Dermatology group. *p < 0.05; **p < 0.01; ***p < 0.001.
Current usage metrics show cumulative count of Article Views (full-text article views including HTML views, PDF and ePub downloads, according to the available data) and Abstracts Views on Vision4Press platform.
Data correspond to usage on the plateform after 2015. The current usage metrics is available 48-96 hours after online publication and is updated daily on week days.
Initial download of the metrics may take a while.