Fig. 2
Download original image
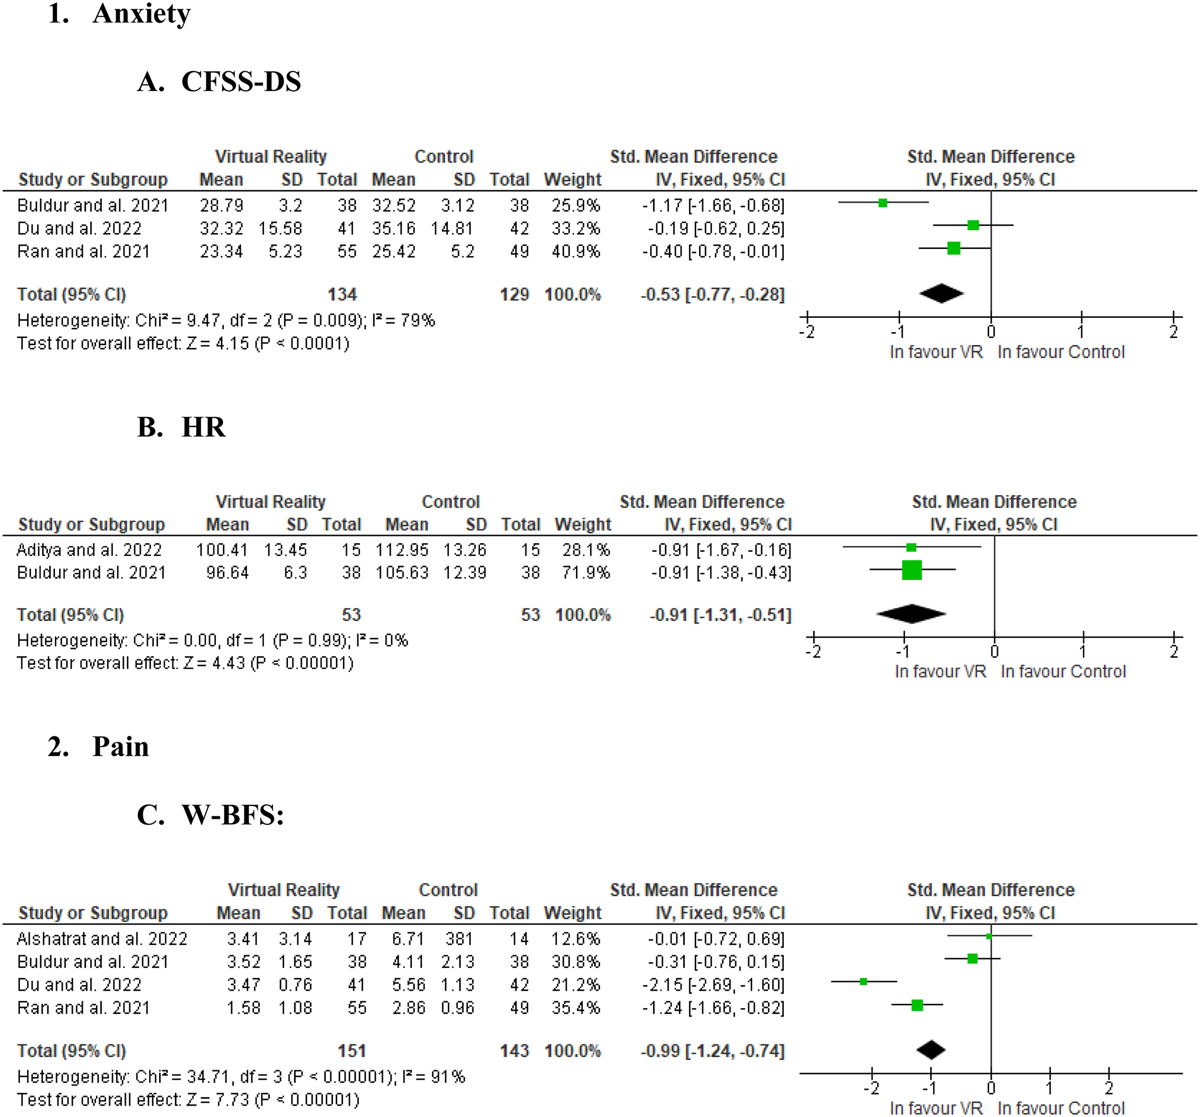
(A) Forest plot of CFSS-DS. (B) Forest plot of HR (C) Forest plot of W-BFS. The squares represent the effect sizes of each of the studies (the size is proportional to the weight of the study) and the lines on the abscissa indicate the 95% confidence interval. The solid diamonds represent the size of the overall effect (on the abscissa the width indicates the 95% confidence interval). Total: number of subjects.
Current usage metrics show cumulative count of Article Views (full-text article views including HTML views, PDF and ePub downloads, according to the available data) and Abstracts Views on Vision4Press platform.
Data correspond to usage on the plateform after 2015. The current usage metrics is available 48-96 hours after online publication and is updated daily on week days.
Initial download of the metrics may take a while.