Fig. 2
Download original image
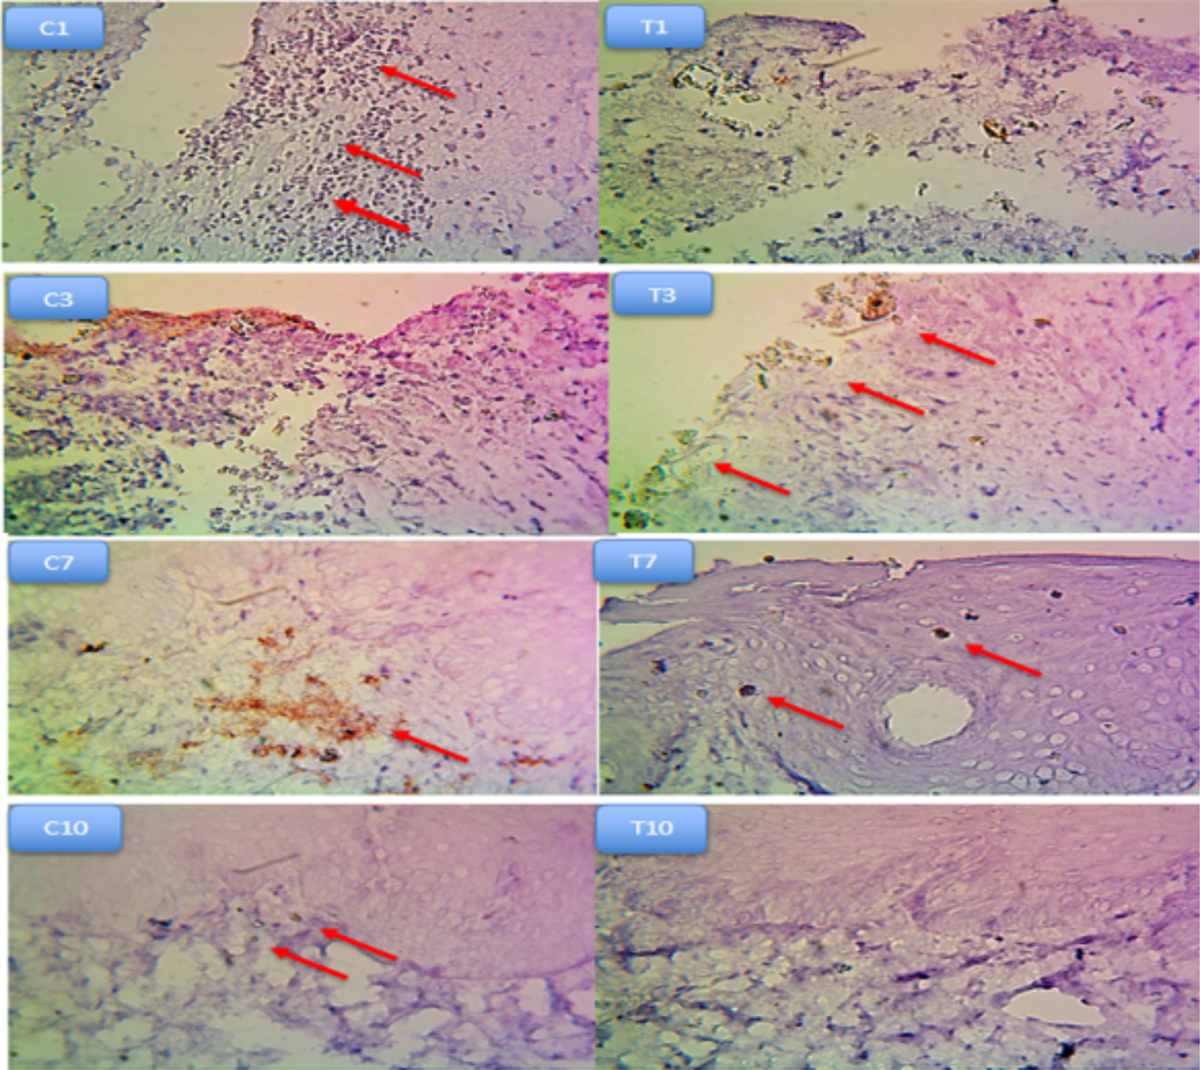
Photomicrographs of rabbit oral mucosa for immunohistochemical examination of TNF-α. C1: Heavy expression of TNF-α (arrows) in control group compared to (T1) treatment group at one-day interval reveals heavy infiltration of inflammatory cells. C3: TNF-α also continue to express in control group, while reduced in treatment group (arrows) (T3) at three-day interval. C7&T7: Control and treatment group at seven-day interval, showed remission of TNF-α in (T3) in contrast to (arrows) (C7) control group (arrow). C10: Control group appeared slightly expression of TNF-α (arrows) compared to completely absence of TNF-α in (T10) treatment group at 10-day interval. 100×.
Current usage metrics show cumulative count of Article Views (full-text article views including HTML views, PDF and ePub downloads, according to the available data) and Abstracts Views on Vision4Press platform.
Data correspond to usage on the plateform after 2015. The current usage metrics is available 48-96 hours after online publication and is updated daily on week days.
Initial download of the metrics may take a while.