Fig. 1
Download original image
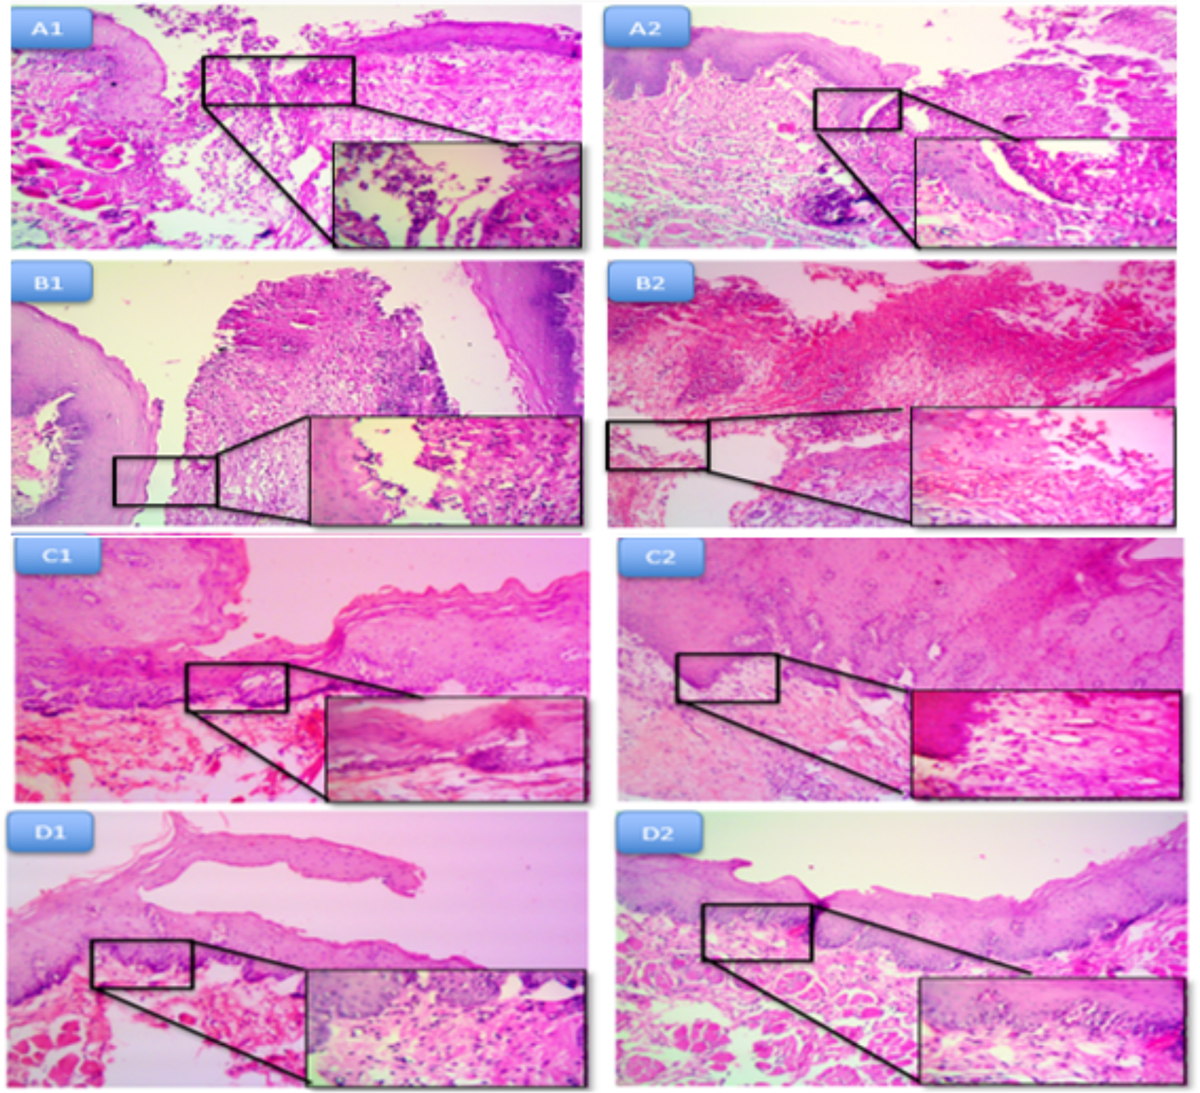
Photomicrographs of rabbit oral mucosa for histopathological examination. A1&2: Control and treatment group respectively at one-day interval reveals heavy infiltration of inflammatory cells. B1&2: Control and treatment group respectively at three-day interval reveals slightly decrease of inflammation in treatment group compared to control group. C1&2; D1&2: Control and treatment group at seven-day interval and control and treatment group at 10-day interval respectively show superior healing process and decreasing of inflammatory reaction and formation of granulation tissue more regular than control group. H&E stain, 100×, 400×.
Current usage metrics show cumulative count of Article Views (full-text article views including HTML views, PDF and ePub downloads, according to the available data) and Abstracts Views on Vision4Press platform.
Data correspond to usage on the plateform after 2015. The current usage metrics is available 48-96 hours after online publication and is updated daily on week days.
Initial download of the metrics may take a while.