| Issue |
J Oral Med Oral Surg
Volume 31, Number 2, 2025
|
|
|---|---|---|
| Article Number | 12 | |
| Number of page(s) | 9 | |
| DOI | https://doi.org/10.1051/mbcb/2025019 | |
| Published online | 27 May 2025 | |
Original Research Article
Rack1 and Pon1 as predictive hub genes in WNT-based oral cancer: an interactomic approach
1
Department of Periodontics, Saveetha Dental College and Hospital, Saveetha Institute of Medical and Technical Sciences, Saveetha University, Chennai, India
2
Department of Oral Biology, Saveetha Dental College and Hospitals, Saveetha Institute of Medical and Technical Sciences, Saveetha University, Chennai, India
3
Department of Periodontology, Government Dental College and Hospital Ahmedabad, Ahmedabad, India
4
College of dentistry, Department of Clinical Sciences, Centre for Medical and Bio-allied Health Sciences Research, Ajman University, Ajman, United Arab Emirates
5
Basic Sciences Department, Biomedical Stomatology Research Group, Faculty of Dentistry, Universidad de Antioquia, Medellín, Colombia
* Correspondence: martin.ardila@udea.edu.co
Received:
15
January
2025
Accepted:
31
March
2025
Objective: This study aims to identify and predict hub genes in the salivary transcriptome of oral cancer and healthy samples. Materials and methods: Salivary proteomic analysis was performed using samples from oral cancer patients and healthy controls, focusing on the parotid and submandibular glands. Gene set enrichment analysis (GSEA) was used to explore the enrichment of Kyoto Encyclopedia of Genes and Genomes (KEGG) and Gene Ontology (GO) pathways. Protein–protein interaction (PPI) networks were constructed using the STRING database and visualised in Cytoscape. Machine learning models, including naïve Bayes and neural networks, were applied to predict interactomic hub genes based on differentially expressed gene (DEG) data. Results: The machine learning models achieved an overall accuracy of 83% for the naïve Bayes classifier and 79% for the neural networks. Class-specific accuracies were 75% and 58%, respectively. Hub genes such as RACK1 and PON1 were identified as central interactomic players. The receiver operating characteristic curve demonstrated the model's capacity to differentiate between hub and non-hub genes, showcasing the potential for identifying critical biomarkers in oral cancer. Conclusions: The predictive accuracy of the naïve Bayes and neural network models underscores their potential in identifying key interactomic genes, which could improve treatment strategies and drug design.
Key words: Hub genes / oral cancer / transcriptome / protein– / protein interaction / machine learning / naïve Bayes / neural networks
© The authors, 2025
 This is an Open Access article distributed under the terms of the Creative Commons Attribution License (https://creativecommons.org/licenses/by/4.0), which permits unrestricted use, distribution, and reproduction in any medium, provided the original work is properly cited.
Introduction
Cancer remains a significant global health challenge, with projected mortality rates reaching 29 million by 2040. Standard treatments, including surgery, radiotherapy, and chemotherapy, provide limited efficacy due to the intricate molecular networks involved in cancer progression and metastasis [1,2]. Understanding the molecular mechanisms underlying cancer is essential for the development of novel therapies. However, drug treatment strategies are often limited by the complexity of real-world biological systems, necessitating innovative approaches to assess molecular targets for patient benefit [2,3].
Oral cancer, particularly oral squamous cell carcinoma (OSCC), accounts for 2% −3% of all malignancies worldwide [4]. OSCC is the most common form, with a five-year survival rate of approximately 50%. Risk factors include tobacco use, alcohol consumption, poor oral hygiene, and HPV infection. In the United States alone, OSCC results in approximately 40,000 new cases and 10,000 deaths annually [5]. Delayed diagnosis contributes to the disease's high morbidity and mortality.
Saliva is emerging as a promising non-invasive diagnostic medium for early cancer detection. Saliva offers advantages over traditional methods like blood tests and biopsies, including noninvasive collection, broad screening, cost-effectiveness, rich biomarker content, and real-time treatment efficacy and disease progression monitoring. However, saliva's potential in oral cancer diagnostics is limited by its variability, lower biomarker concentration, limited research, risk of sample contamination, and lower diagnostic accuracy compared to traditional methods. A previous study identified 56 upregulated and 170 downregulated DEGs in OSCC samples. Eleven hub genes with high connectivity were highlighted, with four showing significant expression changes in head and neck squamous cell carcinoma (HNSCC) patients, according to Wan et al. [2]. Another study found that miR-30c-5p, which is downregulated in OSCC saliva [6], differentiated cases from controls with 86% sensitivity and 74% specificity, suggesting its potential for early detection of OSCC. The study also revealed that miR-30c-5p targets were enriched in the p53 and Wnt signalling pathways implicated in OSCC [7]. The Wnt/β-catenin signalling pathway is influenced by antagonists such as the Dickkopf family and Wnt inhibitory factor 1. However, in oral squamous cell carcinoma (OSCC), the expression of these antagonists is reduced due to DNA methylation, resulting in β-catenin accumulation and activation of oncogenic target genes. The precise role of β-catenin in oral cancer, particularly OSCC, remains unclear. Cytoplasmic localisation of β-catenin is associated with poor differentiation and aggressive tumour behaviour, whereas low nuclear localisation may indicate potential transcriptional activity. Additionally, overexpression of Wnt ligands may promote tumour progression, and increased expression of Wnt/β-catenin target genes can enhance cell migration and invasion. Therefore, it is essential to understand the regulatory mechanisms of β-catenin in the context of oral carcinogenesis.
Hub genes, which are genes critically connected within a protein–protein interaction (PPI) network, play pivotal roles in cellular processes, acting as key regulators of pathways influencing cancer progression, metastasis, and treatment response. In OSCC, alterations in hub gene expression can disrupt normal signalling pathways, leading to enhanced proliferation, evasion of apoptosis, and increased invasive potential. Hub genes that interact with the Wnt pathway may modulate its activation or inhibition, influencing processes such as epithelial–mesenchymal transition (EMT) and metastasis. Hub genes within protein–protein interaction (PPI) network are critical regulators of cellular processes, often interacting with multiple proteins to control essential pathways. Investigating these genes may reveal key pathways involved in cancer development, which may serve as potential therapeutic targets or diagnostic biomarkers [2,8]. Identifying hub genes within the salivary proteome could uncover crucial regulatory mechanisms and pathways that drive OSCC progression.
The Wnt signalling pathway is crucial in oral cancer. RACK1 plays a significant role as a tumour suppressor linked to M2 macrophage infiltration and may enhance antitumour immunity [9]. Hyperlipidaemia can impair the effectiveness of parathyroid hormone (PTH) on bone [10], while RACK1 silencing in oral cancer cells induces cell cycle arrest and reduces tumour marker expression [11]. Additionally, changes in paraoxonase (PON) enzyme levels have been observed in various cancers, indicating their relevance in tumour biology [12]. By focusing on Wnt-related hub genes, such as RACK1 and PON1, we may identify novel therapeutic targets and diagnostic biomarkers for oral cancer.
This study aimed to identify and predict hub genes within the salivary transcriptome from oral cancer patients and healthy controls. Special attention is given to the Wnt signalling pathway due to its involvement in oral cancer progression. Early detection of these hub genes could improve patient outcomes significantly [13,14].
Materials and methods
Salivary differential gene expression analysis
The Human Salivary Proteome (HSP) Wiki is a public platform that compiles and retrieves curated data on the salivary proteome. It consolidates information from various databases and studies, allowing users to explore and annotate salivary protein data. The platform aims to enhance understanding, stimulate research, and foster interdisciplinary collaborations in oral and systemic disease diagnosis and treatment.
Salivary proteome analysis was performed using samples from individuals diagnosed with oral cancer (IDs: 1023–1031) and healthy individuals (IDs: 4256–4262). Data originating from the parotid and submandibular glands are available at salivaryproteome.org. Differentially expressed gene (DEG) analysis was conducted to identify genes exhibiting significant expression differences between OSCC and healthy controls [15]. We used the differential gene expression widget available on this site, which includes all preprocessing steps and is used to identify differential gene expression.
Cytoscape and cytohubba
We identified the most significant differential genes from our analysis and performed an interactome analysis using Cytoscape. The CytoHubba plugin was used to determine the key hub genes based on the maximum clique centrality method.
Machine learning for interactomic hub gene prediction
Machine learning methods were applied to predict interactomic hub genes by analyzing transcriptomics data from DEG analysis. The process involved several key steps: data preprocessing, feature selection, labelling, model training, evaluation, feature importance ranking, and interpretation and validation.
Data Preprocessing and Feature Selection
To ensure data quality, we implemented several preprocessing steps. First, we identified and removed low-quality samples that did not meet our predefined criteria. Next, we addressed any missing values by imputing them with appropriate statistical methods or excluding them, depending on their significance to the overall dataset. These measures were taken to enhance the reliability of our analysis and maintain the data's integrity. We implement feature selection to enhance the accuracy and efficiency of predictive models. Methods such as correlation analysis and differential gene expression analysis help eliminate noise, prioritising significant features. These approaches evaluate hub genes within the interactome, pinpointing those with high connectivity and relevance.
Model training and evaluation
Machine learning models such as naïve Bayes and neural networks were trained on the labelled data. They assessed performance using standard metrics such as accuracy, precision, recall and F1-score, ensuring effective classification of interactomic hub genes using an 80:20 split for training and testing.
Naïve bayes architecture
Naïve Bayes is a probabilistic approach to classification that relies on Bayes' Theorem and a strong independence assumption among features. The posterior probability of a class given features is calculated using the formula P(C | X) = \frac{P(C | X) \cdot P(C)}{P(X}). The “naïve” aspect of naïve Bayes comes from the assumption that all features are independent given the class label. This simplifies computation but may not hold in real-world scenarios. The classification process involves calculating the posterior probability of each class and predicting the class with the highest probability. The training process involves estimating probabilities, such as prior probabilities and likelihood for each feature given each class. The algorithm works by estimating the probability of each feature given a class label and then predicting the class with the highest posterior probability. A key hyperparameter, alpha, was adjusted to address zero probabilities and enhance the model's robustness. By applying naïve Bayes, the model's simple architecture efficiently handled the complex differential gene expression data.
Neural networks architecture
Neural networks are powerful deep learning models inspired by the structure of the human brain. They consist of interconnected layers of artificial neurons: an input layer, one or more hidden layers, and an output layer. For this study, the neural network was optimised using the Adam optimiser, which uses an adaptive learning rate and momentum to optimise the network weights during training. The neural network architecture can be constructed using deep learning libraries like TensorFlow and PyTorch. The architecture consists of an input layer, hidden layers, L2 regularisation, and an output layer. The input layer accepts data, and its dimensions are specified. The hidden layers extract features and patterns from the input data, each with a specific number of neurons. The rectified linear unit (ReLU) activation function introduces non-linearity, allowing the model to learn more complex relationships. L2 regularisation is incorporated to mitigate overfitting and penalises the model for large weights. The output layer, which includes the number of neurons, corresponds to the number of output classes in the classification task. A softmax activation function is typically employed for multi-class classification problems. The model is compiled using the Adam optimiser, with categorical cross entropy loss for multi-class classification tasks and binary cross entropy for binary classification. The model summary outlines the architecture, including the number of layers, layer dimensions and trainable parameters.
Results
Figure 1 is a volcano plot used to visualise DEGs from the dataset. The plot represents the relationship between fold change and statistical significance (p-values) for each gene. The x-axis shows the log₂ fold change (log₂FC), which shows the magnitude of change in gene expression, while the y-axis shows the −log₀(p-value), representing the statistical significance of the change.
Genes that are significantly upregulated (higher expression) are represented in red on the right-hand side, while genes that are significantly downregulated (lower expression) are shown in blue on the left. The genes plotted in gray are considered non-significant, indicating minimal or no change in expression levels. The dashed horizontal line represents the significance threshold (p < 0.05), and the vertical dashed lines indicate the fold change cutoffs.
The following genes are significantly upregulated in oral cancer: IgG1, MMP-9, CYP2E1, and EGFR. IgG1, a critical subclass of immunoglobulin G, plays a vital role in immune responses, antibody-dependent cellular cytotoxicity, and complement activation; its levels often change in oral cancer patients, and therapeutic antibodies typically use IgG1 to target tumour antigens. Oral cancer is characterised by immune evasion, impairing immune responses through antibody-mediated mechanisms. matrix metalloproteinase-9 (MMP-9) facilitates extracellular matrix degradation, promoting tissue remodeling, angiogenesis, and metastasis; its overexpression in oral squamous cell carcinoma (OSCC) correlates with tumour invasion and poor prognosis. Cytochrome P450 2E1 (CYP2E1) metabolises xenobiotics and procarcinogens, such as alcohol and tobacco, producing reactive oxygen species (ROS), contributing to oxidative stress. The epidermal growth factor receptor (EGFR), a tyrosine kinase, regulates cellular proliferation, survival, and differentiation and is frequently overexpressed in OSCC, leading to unchecked cell growth and resistance to apoptosis. The downregulated genes include SOD1, ESR1, and TNF. SOD1, an antioxidant enzyme, reduces oxidative stress and is often disrupted in cancer, presenting a potential therapeutic target. ESR1, an oestrogen receptor, plays a crucial role in regulating cell growth and is associated with oral cancer progression, serving as a potential biomarker. TNF, a pro-inflammatory cytokine, facilitates inflammation and immune evasion in OSCC, underscoring its significance in oral cancer progression and therapy. This visualisation allows for the quick identification of key genes with significant up- or down-regulation in the dataset, highlighting those most likely involved in relevant biological processes or conditions under study.
Figure 2 illustrates the protein-protein interaction (PPI) network of the top differentially expressed hub genes identified in the study. The left side of the figure displays a comprehensive interactome, showcasing various proteins connected through their interactions. Each node represents a protein, while the edges indicate interactions between them.
The right side highlights a sub-network of the most significant hub genes identified through mCODE analysis.
Identifying sub-networks in a biological network using the MCODE (Molecular Complex Detection) algorithm involves several steps. MCODE is a plugin for Cytoscape, a software platform for visualising complex networks and integrating these with any attribute data. We execute the algorithm to identify sub-networks using MCODE, examine densely connected areas, evaluate clusters, leverage Cytoscape's visualisation tools, and export the identified sub-networks for additional documentation or analysis.
The identified hub genes include RBP4, RPLP1, RPL18, EIF4H, C9, RPL22, RPL7, HRG, EIF3E, ITIH2, RPL15, GC, RPS8, PON1, SERPINA3, A1BG, SERPIND1, ITIH1, RPS10, APOM, SERPINF2, EIF5A, SERPINC1, PSMD12, SERPINA6, CFB, RPS7, AFM, HPX, and RPS15A. This visualisation provides insights into the complex interactions among these proteins, facilitating a better understanding of their functional roles and potential contributions to disease mechanisms.
Hub genes indicate that RACK1, a key hub gene, negatively affects Disheveled (Dvl) stability, thereby regulating Wnt signalling. By promoting Dvl degradation through lysosomes, enhanced by autophagy, RACK1 reveals a new regulatory role in this pathway. In human cancers, the overexpression of the Wnt/β-catenin signalling pathway leads to deregulation. Another hub gene, PON1, improves cortical bone characteristics by increasing oxidative stress and influencing PTH recith reeptor expression, suggesting it may restore PTH responsiveness. Serpina3/Serpina3n is linked to interstitial cystitis/bladder pain syndrome (IC/BPS); its upregulation aids in bladder injury recovery and promotes cell growth, marking it as a potential therapeutic target. Notably, Serpina3 expression fluctuates with oral cancer progression, decreasing in early stages and increasing in later stages due to tumour advancement.
Figure 3 shows a comprehensive gene interaction network highlighting the hub genes identified from the differential gene expression analysis. Each node in the network represents a specific hub gene, while the connections (edges) between nodes indicate interactions among these genes. The radial layout facilitates the visualisation of relationships and interconnectivity among the hub genes, making it easier to identify clusters and pathways that may be involved in the underlying biological processes.
Key genes from networks include SERPINA1, ITIH, RPL, RPS, GC, PON, APO, EIF3F, HRG, PLP1, PLP1, and PSMD12. SERPINA1 inhibits proteases like neutrophil elastase, protecting tissues from inflammation-induced damage. Dysregulation of SERPINA1 can lead to chronic inflammation, a key driver of oral cancer progression. ITIH stabilises the extracellular matrix (ECM) and regulates inflammation, which is critical for tumour invasion and metastasis. RPL and RPS are essential components of ribosomes, and altered ribosomal protein expression is linked to increased cell proliferation and tumour growth. GC transports vitamin D and modulates immune responses, while PON protects against oxidative stress, which contributes to DNA damage and carcinogenesis. APO is involved in lipid transport and metabolism, and dysregulated lipid metabolism is associated with cancer progression and metastasis. EIF3F regulates translation initiation and protein synthesis, and HRG modifies angiogenesis and immune responses. PLP1 is involved in cell signalling and membrane structure, and PSMD12 is part of the proteasome complex involved in protein degradation.
This network serves as a valuable tool for understanding how these hub genes interact with one another. It provides insights into their potential roles in the context of oral cancer and guides future research directions aimed at therapeutic targeting.
Table I presents the overall accuracy and class accuracy of the Naïve Bayes and Neural Networks models.
The naïve Bayes model has an AUC of 0.830, indicating excellent performance in distinguishing between positive and negative genes. Its classification accuracy is 0.75, suggesting that 75% of predictions were correct. The F1 score is 0.75, reflecting a good balance between precision and recall. The model predicts a hub gene 76.6% of the time, demonstrating reliability. Its recall is 0.750, indicating that 75% of actual hub genes were correctly identified. High recall is crucial in cancer genomics as it minimises the risk of missing important hub genes. The model's specificity is 0.77, suggesting fair performance in correctly identifying non-hub genes. Overall, The naïve Bayes model is dependable in this study, exhibiting a high accuracy rate and a solid balance between positive predictive value and true positive detection. In contrast, the Neural network model has a lower AUC than The naïve Bayes model, indicating a less effective ability to discriminate between hub and non-hub genes. Its classification accuracy is 58%, reflecting poor overall performance. The model's F1 score is low, indicating an inadequate balance between precision and recall. The precision is 33.6%, suggesting that many predictions could be incorrect. The recall is 0.580, implying that the model identifies only about half of the actual hub genes, potentially leading to significant omissions in biological relevance. The specificity is 42%, highlighting a high rate of false positives. Overall, the model struggles to accurately identify non-hub genes, indicating a high rate of false positives. The naïve Bayes model outperforms the Neural network model in predicting hub genes in oral cancer, with superior AUC, classification accuracy, F1 score, precision, recall, and specificity. In contrast, the neural network model is less effective with poorer scores.For practical applications, The naïve Bayes model would be more reliable for research and clinical decisions regarding hub genes involved in oral cancer, while the Neural Network would likely require further optimisation or data enhancement to improve its predictive capabilities.
The naïve Bayes model is a reliable choice for predicting hub genes in oral cancer due to its high accuracy, solid F1 scores, good precision, and recall. It has an AUC of 0.830, indicating excellent performance in differentiating between hub and non-hub genes. The classification accuracy is 0.750, with 75% of predictions correct. The model has a good balance between precision and recall, with a precision of 76.6% and a recall of 0.750. It also has a high rate of false positives, indicating a fair performance in identifying non-hub genes.
On the other hand, the Neural network model has a lower AUC, less effective discrimination capability, and a classification accuracy of 0.58. It has a low F1 score, indicating an inadequate balance between precision and recall, resulting in limited predictive reliability. The model has a high proportion of incorrect predictions among hub genes, raising concerns about its practical utility. The model identifies only about half of the actual hub genes, posing a risk of missing significant biological markers. The model also has a high rate of false positives, suggesting a need for optimisation to enhance its effectiveness in identifying hub genes.
Figure 4 illustrates the Receiver Operating Characteristic (ROC) curve for classifying interatomic hub genes versus non-hub genes. This graphical representation showcases the performance of a binary classification model by plotting the True Positive Rate (TPR) against the False Positive Rate (FPR) across various classification threshold settings. The ROC curve for non-hub genes indicates a gradual improvement in its ability to differentiate between positive and negative classifications, although its predictive accuracy remains limited. In contrast, the ROC curves reveal that hub genes typically exhibit greater classification accuracy than non-hub genes, highlighting their potential importance. A higher AUC value signifies their effectiveness in class differentiation.
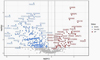 |
Fig. 1 Volcano Plot Showing Differentially Expressed Genes. |
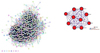 |
Fig. 2 Protein-Protein Interaction Network of Differentially Expressed Hub Genes. |
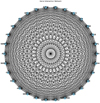 |
Fig. 3 Gene Interaction Network of Differentially Expressed Hub Genes. |
Accuracy and class accuracy of Naïve bayes and Neural networks.
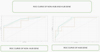 |
Fig. 4 Receiver Operating Characteristic Curve for Interatomic Hub and Non-Hub Genes. |
Discussion
Saliva has emerged as a promising alternative to blood serum and urine for health monitoring due to its affordability, safety, simplicity, and non-invasiveness [5]. The advantages of saliva analysis include non-invasive sample collection, straightforward storage, patient participation, cost-effectiveness, and a reduced risk of infection [6]. Saliva's variability in sample collection, susceptibility to contamination, and the influence of oral health status on biomarker levels are critical challenges impacting diagnostic accuracy and reliability. The field of “salivaomics” covers various components such as salivary genomes, transcriptomics, proteomics, metabolomics, microbiomics, and microRNAs. Mass spectrometry and proteomics have identified over 3,000 distinct proteins in saliva, which could be used to tailor therapeutic approaches. Hub genes found in saliva are essential for identifying biomarkers, influencing health pathways, and assisting in creating targeted diagnostics and personalised treatment strategies for oral cancer.
Diagnosing oral cancer (OC) depends on thorough oral examinations and tissue biopsies for accurate detection. The progression of oral carcinogenesis involves several histopathological stages and molecular changes, underscoring the importance of proteomics in understanding gene expression variations. This study analysed key genes identified from salivary samples of both oral cancer and healthy individuals, with the top hubs including RBP4, RPLP1, RACK1, RPL18, EIF4H, C9, RPL22, RPL7, HRG, EIF3E, TIH2, RPL15, GC, RPS8, PON1, SERPINA3, and A1BG. These hub genes are involved in Wnt signalling pathways related to oral cancer (Figs 1–3) [3]. The interconnected nature of oral cancer processes indicates that targeting key nodes such as EGFR, MMP-9, or SERPINA1 could disrupt multiple pathways, presenting potential therapeutic strategies and assisting in early detection and prognosis.
Studies have identified potential salivary proteins like soluble CD44 and tumour markers such as Cyfra21-1, cancer antigen 125, and tissue polypeptide antigen for diagnosing OSCC. Biomarkers like soluble CD44, Cyfra21-1, cancer antigen 125, tissue polypeptide antigen, and the p53 autoantibody, when measured in saliva show promise for distinguishing cancerous from benign conditions [1,3–5]. However, the predictive ability of these biomarkers for OSCC detection is limited, as they were identified individually. Interestingly, serum levels of these markers in OSCC patients demonstrate comparable diagnostic value to salivary levels.
The Wnt proteins [10,16,17] play a crucial role in embryonic development and tissue homeostasis, with dysregulation of Wnt signalling is closely associated with various diseases [18], including cancer [19]. Wnt ligands initiate signal transduction by interacting with Frizzled and LRP5/6 receptors, recruiting Dishevelled and disrupting the β-catenin destruction complex [20], and regulating Wnt target gene expression through β-catenin-independent pathways [21]. The Dvl proteins (Dvl1, Dvl2, and Dvl3) are central to relaying Wnt signalling, and their stability and activity are tightly regulated [22–25].
Recent research has shown that RACK1 (receptor for activated C kinase 1) negatively regulates Disheveled (Dvl) stability and Wnt signalling. RACK1 interacts with Dvl proteins and promotes their degradation via lysosomes, a process enhanced by autophagy [26]. RACK1, recognised as a key hub gene in this study, interacts with LC3, enhancing the interaction between LC3 and Dvl2, which results in the degradation of Dvl protein via autophagy. These results indicate that RACK1 plays a novel regulatory role in Wnt signalling by influencing Dvl stability. The abnormal activation of the Wnt/β-catenin signalling pathway is prevalent in human cancers, with overexpression of Wnt ligands leading to dysregulation, though no mutations in Wnt/β-catenin pathway components have been identified.
Previous studies have shown that the overexpression of PON1 improves cortical bone characteristics by increasing oxidative stress, PTH receptor expression, and bone regulatory genes, which are identified as hub genes in this study [27]. This suggests that PON1 could restore responsiveness to parathyroid hormone (PTH) by interacting with oxidative stress mechanisms and Wnt signalling pathways.
Another significant hub gene, Serpina3/Serpina3n, has been implicated in interstitial cystitis/bladder pain syndrome (IC/BPS) [28]. Serpina3 expression decreased in IC/BPS bladder tissues, but upregulation alleviated bladder injury, reduced pro-inflammatory factors, and promoted cell growth, indicating its potential as a therapeutic target. Elevated SERPINA3 levels in patients with squamous esophageal cancer and extranodal NK/T-cell lymphoma have been observed, though the mechanism remains unclear [4,28]. Serpina3 expression fluctuates during cancer development, decreasing in early stages and increasing in advanced stages, possibly due to tumour progression.
Our study's machine learning models demonstrated strong predictive performance for interactomic hub genes. The Naïve Bayes classifier achieved an accuracy of 83% and a class accuracy of 75%, while the neural network model showed a slightly lower overall accuracy of 79% with a class accuracy of 58% (Tab. I, Fig. 4) [29]. The naïve Bayes model outperformed the neural network, achieving greater accuracy (83% vs. 79%), class accuracy (75% vs. 58%), and AUC (0.830 vs. a lower AUC for the neural network). This suggests it has a stronger capacity to distinguish between hub and non-hub genes. This superior performance can be linked to Naïve Bayes' effectiveness with small datasets and its capacity to model probabilistic relationships well. In contrast, the neural network's performance may have suffered due to the limited sample sise and class imbalance, resulting in lower recall and F1 scores. To enhance both models, utilising larger datasets, employing class imbalance mitigation techniques, and exploring further optimisation strategies— such as advanced feature engineering and data augmentation—are recommended. These enhancements could bolster both approaches' predictive accuracy and reliability in identifying hub genes for oral cancer research. Feature engineering methods like correlation and differential gene expression analysis enhance model performance by prioritising key biomarkers and reducing noise. Addressing class imbalance through oversampling, undersampling, or synthetic data generation, along with larger datasets, strengthens Naïve Bayes and neural network models' predictive accuracy. Collaborating with research institutions, integrating public genomic databases, or conducting multi-center studies can help gather larger datasets. This approach mitigates class imbalance and boosts reliability in predicting interactomic hub genes.
These models performed well due to their ability to analyse the complexity of PPIs, though factors such as model complexity, data quality, and parameter tuning contributed to the results. Future efforts should concentrate on feature engineering, data augmentation and optimisation strategies to enhance these models. Despite the promising results, limitations in this study included the sample sise and class imbalance, which could be mitigated through larger datasets and the application of balancing techniques. We can further improve the robustness and predictive accuracy of Naïve Bayes and neural network models by overcoming these limitations.
Conclusion
This study highlighted the importance of hub gene interactions and protein–protein interaction networks in oral cancer, which can be used as a basis for new drug development. Both naïve Bayes and neural network models demonstrated high accuracy in predicting interactomic hub genes, indicating promise for accurate classification within PPI networks. Additionally, some of the identified hub genes, such as PON1 and SERPINA3, have bone-related involvement, offering potential biomarkers for improved treatment planning and therapeutic design for oral cancer. By leveraging these findings, future research can advance the development of more effective diagnostic and therapeutic strategies for oral cancer.
Funding
This research did not receive any specific grant from funding agencies in the public, commercial or not-for-profit sectors.
Conflicts of interest
The authors declare that they have no conflicts of interest in relation to this article.
Data availability statement
No data were used in the research described in this article.
Author contribution statement
PKY, RR, RA, DA, NB, AM and CMA: Conception, data analysis, interpretation, and manuscript drafting.
Ethics approval
The authors declare that Ethical approval not required.
References
- Leemans CR, Snijders PJF, Brakenhoff RH. The molecular landscape of head and neck cancer. Nat Rev Cancer 2018;18: 269–82. [CrossRef] [PubMed] [Google Scholar]
- Wan Z, Xiong H, Tan X, Su T, Xia K, Wang D. Integrative multi-omics analysis reveals candidate biomarkers for oral squamous cell carcinoma. Front Oncol 2022;12:794146. [CrossRef] [PubMed] [Google Scholar]
- Umapathy VR, Natarajan PM, Swamikannu B. Review insights on salivary proteomics biomarkers in oral cancer detection and diagnosis. Molecules 2023;28:3282. [CrossRef] [PubMed] [Google Scholar]
- Saproo S, Sarkar SS, Gautam V, Konyak CW, Dass G, Karmakar A et al. Salivary protein kinase C alpha and novel microRNAs as diagnostic and therapeutic resistance markers for oral squamous cell carcinoma in Indian cohorts. Front Mol Biosci 2023;9:1106963. [CrossRef] [PubMed] [Google Scholar]
- Markopoulos AK, Michailidou EZ, Tzimagiorgis G. Salivary markers for oral cancer detection. Open Dent J 2010;4:172–8. [CrossRef] [PubMed] [Google Scholar]
- Zahran F, Ghalwash D, Shaker O, Al-Johani K, Scully C. Salivary microRNAs in oral cancer. Oral Dis 2015;21:739–47. [CrossRef] [PubMed] [Google Scholar]
- Mehterov N, Vladimirov B, Sacconi A, Pulito C, Rucinski M, Blandino G, et al. Salivary miR-30c-5p as potential biomarker for detection of oral squamous cell carcinoma. Biomedicines 2021;9:1079. [CrossRef] [PubMed] [Google Scholar]
- Wang Z, Guan W, Ma Y, Zhou X, Song G, Wei J, et al. MicroRNA-191 regulates oral squamous cell carcinoma cells growth by targeting PLCD1 via the Wnt/β-catenin signalling pathway. BMC Cancer 2023;23:668. [CrossRef] [PubMed] [Google Scholar]
- Deng YZ, Yao F, Li JJ, Mao ZF, Hu PT, Long LY, et al. RACK1 suppresses gastric tumourigenesis by stabilising the β-catenin destruction complex. Gastroenterology 2012;142 (4): 812–823.e15. [CrossRef] [PubMed] [Google Scholar]
- Lu J, Cheng H, Atti E, Shih DM, Demer LL, Tintut Y. Role of paraoxonase-1 in bone anabolic effects of parathyroid hormone in hyperlipidemic mice. Biochem Biophys Res Commun 2013;431 (1): 19–24. [CrossRef] [PubMed] [Google Scholar]
- Bacchetti T, Ferretti G, Sahebkar A. The role of paraoxonase in cancer. Semin Cancer Biol 2019;56:72–86. [CrossRef] [PubMed] [Google Scholar]
- Dan H, Liu S, Liu J, Liu D, Yin F, Wei Z, et al. RACK1 promotes cancer progression by increasing the M2/M1 macrophage ratio via the NF-κB pathway in oral squamous cell carcinoma. Mol Oncol 2020;14:795–807. [CrossRef] [PubMed] [Google Scholar]
- Kumar VS, Kumar PR, Yadalam PK, Anegundi RV, Shrivastava D, Alfurhud AA, et al. Machine learning in the detection of dental cyst, tumour, and abscess lesions. BMC Oral Health 2023;23:833. [CrossRef] [PubMed] [Google Scholar]
- Yadalam PK, Anegundi RV, Ramadoss R. Unsupervised machine learning predicts invasive and undruggable long coding RNA Linc00662, Linc01234, and Spanxa1, Rabphilin 3A, Svil antisense RNA 1 like from oral cancer transcriptomics. Cancer Epidemiol Biomarkers Prev 2023;32:91. [CrossRef] [PubMed] [Google Scholar]
- Lau WW, Hardt M, Zhang YH, Freire M, Ruhl S. The Human Salivary Proteome Wiki: A Community-Driven Research Platform. J Dent Res 2021;100 (13): 1510–1519. [CrossRef] [PubMed] [Google Scholar]
- Liu F, Millar SE. Wnt/beta-catenin signalling in oral tissue development and disease. J Dent Res 2010;89:318–30. [CrossRef] [PubMed] [Google Scholar]
- McCravy MS, Ingram JL. A hint from Wnt: squamous cell differentiation in the airways. Am J Respir Cell Mol Biol 2023;68:601–2. [CrossRef] [PubMed] [Google Scholar]
- Yang P, Huang G, Li Y, Yu L, Yin Z, Li Q. Identification of PANoptosis-related biomarkers and analysis of prognostic values in head and neck squamous cell carcinoma. Sci Rep 2024;14 (1): 9824. [CrossRef] [PubMed] [Google Scholar]
- Yadalam PK, Arumuganainar D, Natarajan PM, Ardila CM. Predicting the hub interactome of COVID-19 and oral squamous cell carcinoma: uncovering ALDH-mediated Wnt/β-catenin pathway activation via salivary inflammatory proteins. Sci Rep 2025;15 (1): 4068. [CrossRef] [PubMed] [Google Scholar]
- Li Y, Huang L, Hu Q, Zheng K, Yan Y, Lan T, Zheng D, Lu Y. WNT7B promotes cancer progression via WNT/β-catenin signalling pathway and predicts a poor prognosis in oral squamous cell carcinoma. BMC Oral Health 2024;24 (1): 1335. [CrossRef] [PubMed] [Google Scholar]
- Mima M, Okabe A, Hoshii T, Nakagawa T, Kurokawa T, Kondo S, et al. Tumourigenic activation around HPV integrated sites in head and neck squamous cell carcinoma. Int J Cancer 2023 May 1;152: 1847–1862. [CrossRef] [PubMed] [Google Scholar]
- Yang K, Zhao J, Liu S, Man S. RELA promotes the progression of oral squamous cell carcinoma via TFAP2A-Wnt/β-catenin signalling. Mol Carcinog 2023;62:641–51. [CrossRef] [PubMed] [Google Scholar]
- Song Y, Song F, Xiao X, Song Z, Liu S. Expression levels of WNT signalling pathway genes during early tooth development. Organogenesis 2023;19:2212583. [CrossRef] [PubMed] [Google Scholar]
- Zhang Z, Pan X, Chen M, Bai M. Wnt signalling in oral and maxillofacial diseases. Cell Biol Int 2022;46:34–45. [CrossRef] [PubMed] [Google Scholar]
- Güney Z, Kurgan Ş, Önder C, Tayman MA, Günhan Ö, Kantarci A, et al. Wnt signalling in periodontitis. Clin Oral Investig 2023;27:6801–12. [CrossRef] [PubMed] [Google Scholar]
- Huang G, Chen S, Washio J, Paka Lubamba G, Takahashi N, Li C. Glycolysis-related gene analyses indicate that DEPDC1 promotes the malignant progression of oral squamous cell carcinoma via the WNT/β-catenin signalling pathway. Int J Mol Sci 2023;24:1992. [CrossRef] [PubMed] [Google Scholar]
- Lu J, Cheng H, Atti E, Shih DM, Demer LL, Tintut Y. Role of paraoxonase-1 in bone anabolic effects of parathyroid hormone in hyperlipidemic mice. Biochem Biophys Res Commun 2013;431:19–24. [CrossRef] [PubMed] [Google Scholar]
- Fang W, Song Q, Lv T, Lv J, Cai Z, Wang Z. Activating the Wnt/β-catenin signal. Int Urol Nephrol 2023;55:3065–3075. [CrossRef] [PubMed] [Google Scholar]
- Ghosh N, Saha I, Sharma N. Interactome of human and SARS-CoV-2 proteins to identify human hub proteins associated with comorbidities. Comput Biol Med 2021;138:104889. [CrossRef] [PubMed] [Google Scholar]
Cite this article as: Yadalam PK, Ramadoss R, Anegundi RV, Arumuganainar D, Brahmbhatt N, Mathew A, Ardila CM. 2025. Rack1 and Pon1 as predictive hub genes in WNT-based oral cancer: an interactomic approach. J Oral Med Oral Surg. 31, 12: https://doi.org/10.1051/mbcb/2025019
All Tables
All Figures
|
Fig. 1 Volcano Plot Showing Differentially Expressed Genes. |
| In the text | |
|
Fig. 2 Protein-Protein Interaction Network of Differentially Expressed Hub Genes. |
| In the text | |
|
Fig. 3 Gene Interaction Network of Differentially Expressed Hub Genes. |
| In the text | |
|
Fig. 4 Receiver Operating Characteristic Curve for Interatomic Hub and Non-Hub Genes. |
| In the text | |
Current usage metrics show cumulative count of Article Views (full-text article views including HTML views, PDF and ePub downloads, according to the available data) and Abstracts Views on Vision4Press platform.
Data correspond to usage on the plateform after 2015. The current usage metrics is available 48-96 hours after online publication and is updated daily on week days.
Initial download of the metrics may take a while.