Open Access
Fig. 2
Download original image
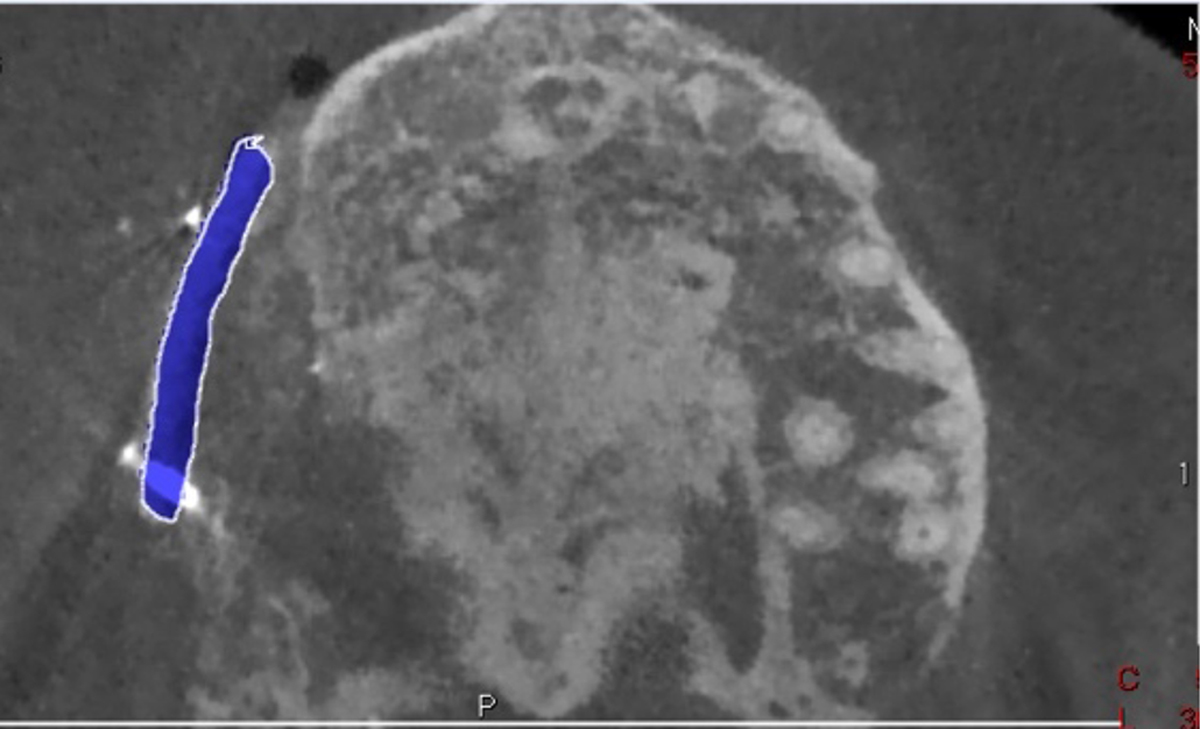
Axial section of CBCT at T0 (same patient as in Fig. 1). The limits of the graft were delimited manually every millimeter and so to determine the volume of interest (blue).
Current usage metrics show cumulative count of Article Views (full-text article views including HTML views, PDF and ePub downloads, according to the available data) and Abstracts Views on Vision4Press platform.
Data correspond to usage on the plateform after 2015. The current usage metrics is available 48-96 hours after online publication and is updated daily on week days.
Initial download of the metrics may take a while.